
400+ Price Predictions & Historical Prices Launch at Helios!
Our price predictions are up to 5x more accurate than industry standards.

Live example of our new price tab. Displaying commodity level for grapes in USD/kg.
We’re thrilled to share one of our biggest releases yet: Helios AI’s is launching 400+ price forecasts and historical price series for 37 agricultural commodities.
Procurement teams face volatile markets, unpredictable climate impacts, and relentless cost pressures. With this new feature, you’ll finally get the clear, data-backed visibility you need to plan smarter, negotiate harder, and protect your margins in the face of uncertainty. This isn’t just “more data.” It’s better intelligence: forecasts up to a year ahead, detailed historical pricing, and clear, accessible explanations of why prices are moving the way they are.
About Our Price Series and Forecasts
We built our pricing tools to give you real answers, not black-box predictions. Here’s what makes them special:

Live example of our pricing table on the commodity level, with a price explanation open to read.
Highly Accurate, 12-Month Forecasts: Updated weekly, our forecasts look up to a year ahead, offering the visibility you need for contracts, planning, and risk management.
Why Prices Move: Every forecast includes an explanation, so you don’t just see where prices are going, but why. Climate shifts, weather events, supply disruptions, demand trends, and more are all part of the analysis.
Superior Accuracy: Our models consistently outperform industry benchmarks — up to 5 times better than forecasts that only consider seasonality or simple supply/demand.
Deep Historical Context: We offer historical pricing back to 2020 at weekly intervals. Understand long-term trends, benchmark suppliers’ prices, and spot seasonal patterns with real data.
Granular Coverage: Our coverage includes commodity-level and country-of-origin-level detail, varieties and types (e.g. Honeycrisp vs. Gala Apples) and even region-level views when available (e.g. US states)
Outlook Even When Data is Limited: If we don’t have enough data for a precise numerical forecast, we still provide pricing outlooks. These give you clear, written guidance on expected price directions and drivers—even without the hard numbers.
Full List of Our Price Series
We’re launching with over 400 price series covering fruits, vegetables, and other critical commodities. Examples include:
Apples (Gala, Honeycrisp, Granny Smith, Red Delicious, by country and region)
Avocados (Hass, Greenskin types, from Mexico, Peru, US, and others)
Bell peppers, watermelons, mangoes, onions, potatoes, and dozens more
New Features: Your Procurement Toolkit Just Got Better
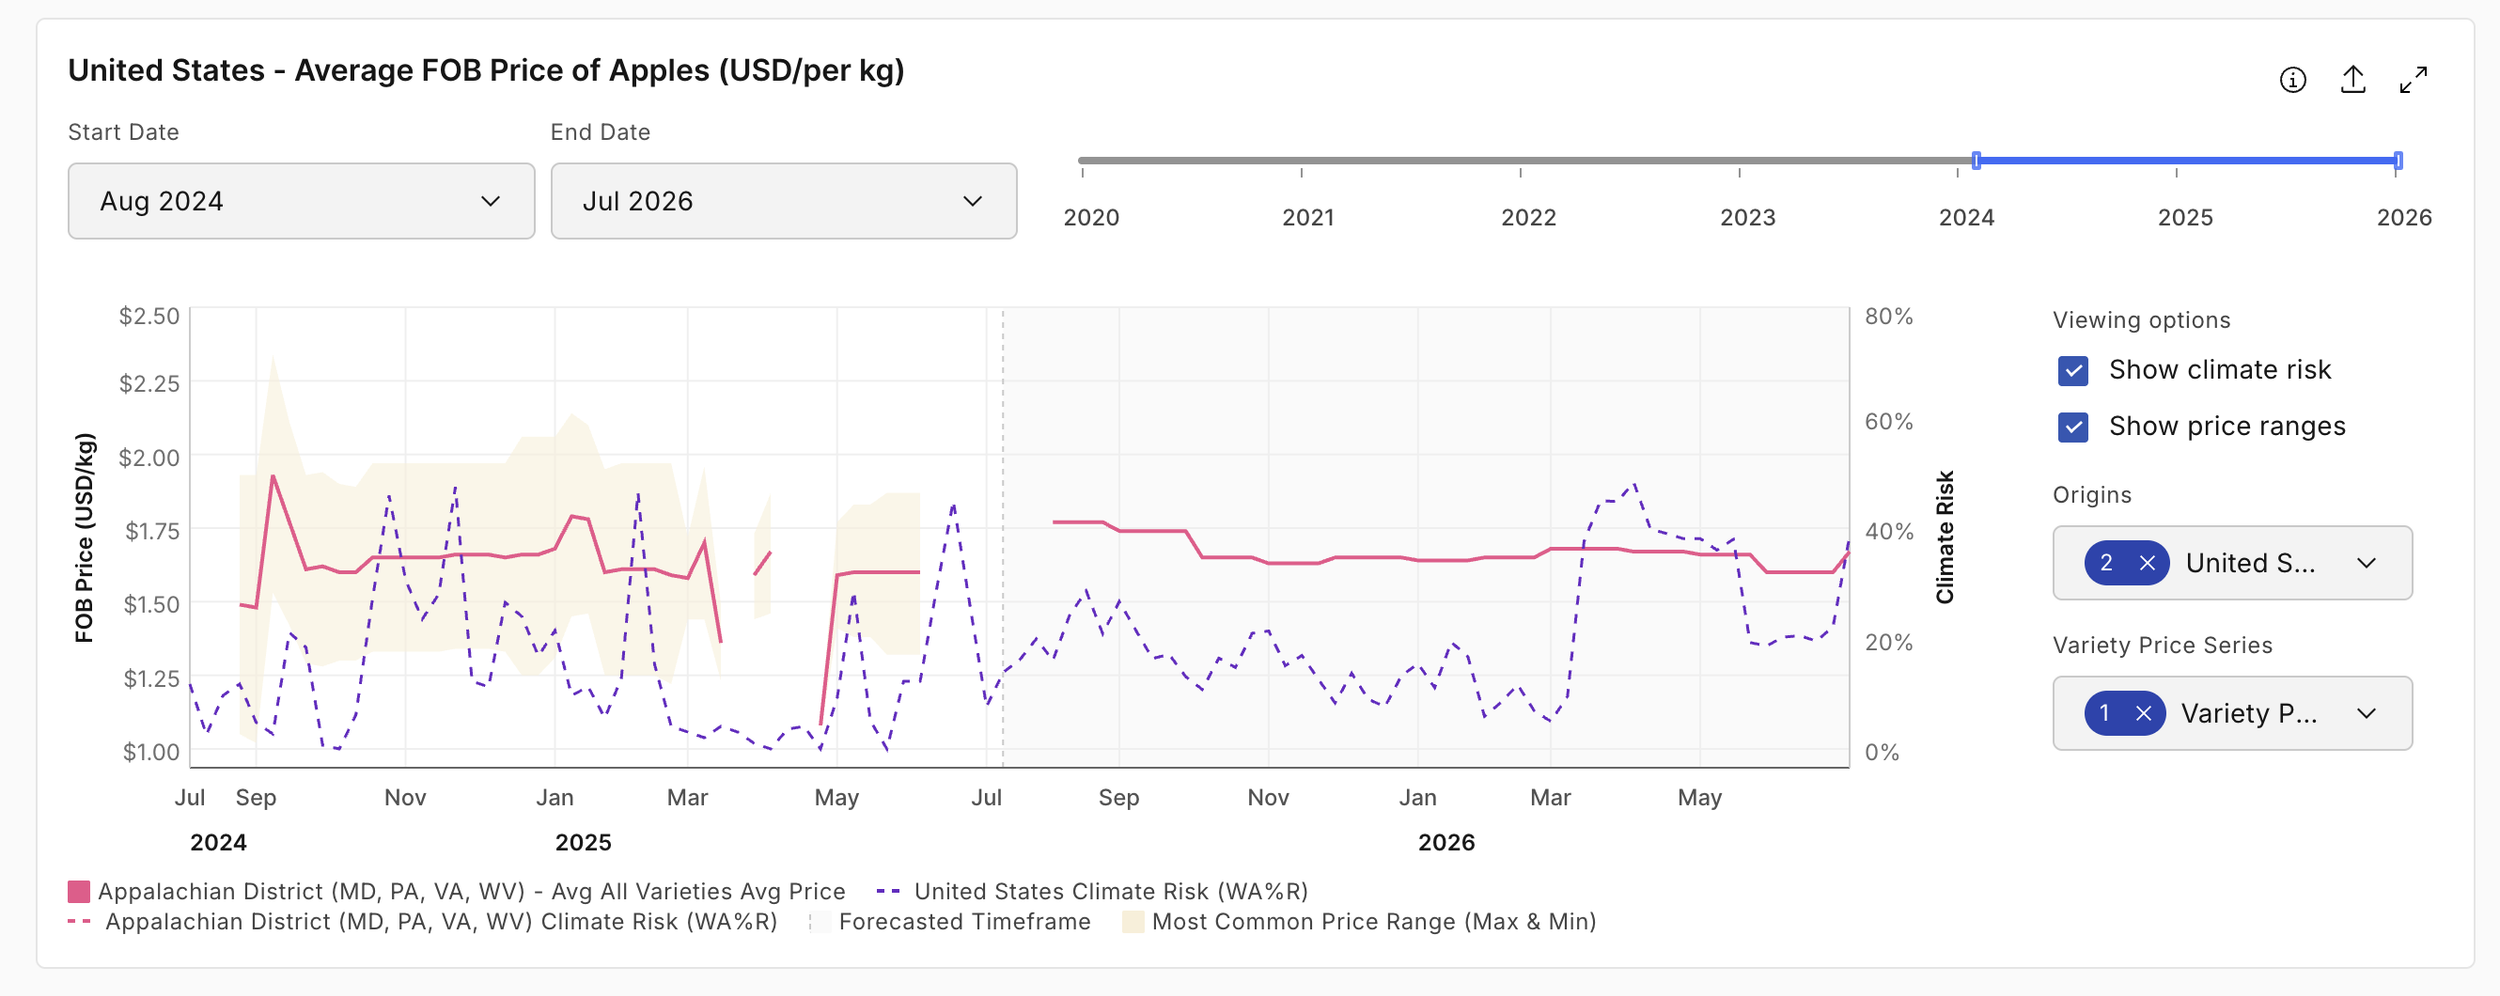
An example of our country-level price graph showcasing Honeycrisp apple prices in the United States, along with price ranges and climate risk selected.
We’ve designed these features so you can go from “What’s the price?” to “What’s happening, why, and what should we do about it?” in one place.
Explore 400+ price series with country, region, and variety breakdowns.
Switch units easily: KG, LB, or MT.
View prices globally, by country of origin, or even by region
Drill into varieties: Compare specific types of apples, grapes, avocados, and more.
Analyze historical trends back to 2020.
See forecasts by month for the next 12 months.
Read price explanations that go into the drivers behind the forecast and how it relates to seasonal trends.
Download data and export charts and tables for your own analysis — individual records or entire tables.
Overlay climate risk factors to see how weather events and climate risk might impact prices.
How This Release Benefits You
This update is for procurement teams that buy, sell, or plan around agricultural commodity prices:
Manufacturers securing inputs and controlling production costs
Distributors/wholesalers negotiating contracts and managing supplier relationships
Retailers planning promotions, stocking strategies, and pricing for end customers are just a few examples
Here’s how our forecasts and historical series will make your life easier:

Negotiate with confidence: Use real, granular price data and forecasts to justify contract terms.
Plan smarter: Avoid buying at peaks, take advantage of lows, and time purchases for maximum savings.
Benchmark supplier bids: Instantly compare what others are paying and hold your vendors to account.
Understand the drivers: Don’t just see that prices are rising. Understand why, from climate risk to geopolitical factors.
Manage risk: Spot upcoming price volatility early so you can hedge, diversify suppliers, or adjust plans.
Forecast demand impacts: Anticipate how price changes will affect your end-product pricing and customer demand.
What’s Coming Next
We’re just getting started. Here’s what you can expect in the coming months:
Expanding from 400+ to over 2,500 forecasts, covering more crops, countries, and varieties.
Exchange-traded commodity cash prices and basis prices.
Processed foods and byproducts like oils, meals, and powders.
More price types, including other incoterms beyond FOB (like wholesale and farmgate prices).
Advanced seasonality tools, helping you see clear year-over-year trends and align with growing seasons.
Deeper historical comparisons so you can analyze multiple years of price behavior in context.
At Helios AI, our goal is simple: give procurement teams the clarity they need to make better decisions. We’re committed to delivering the most comprehensive, actionable pricing intelligence available to the agri-food industry. We’re excited for you to try it out. Log in to your Helios account or sign up for a free trial to explore the new pricing tab today.